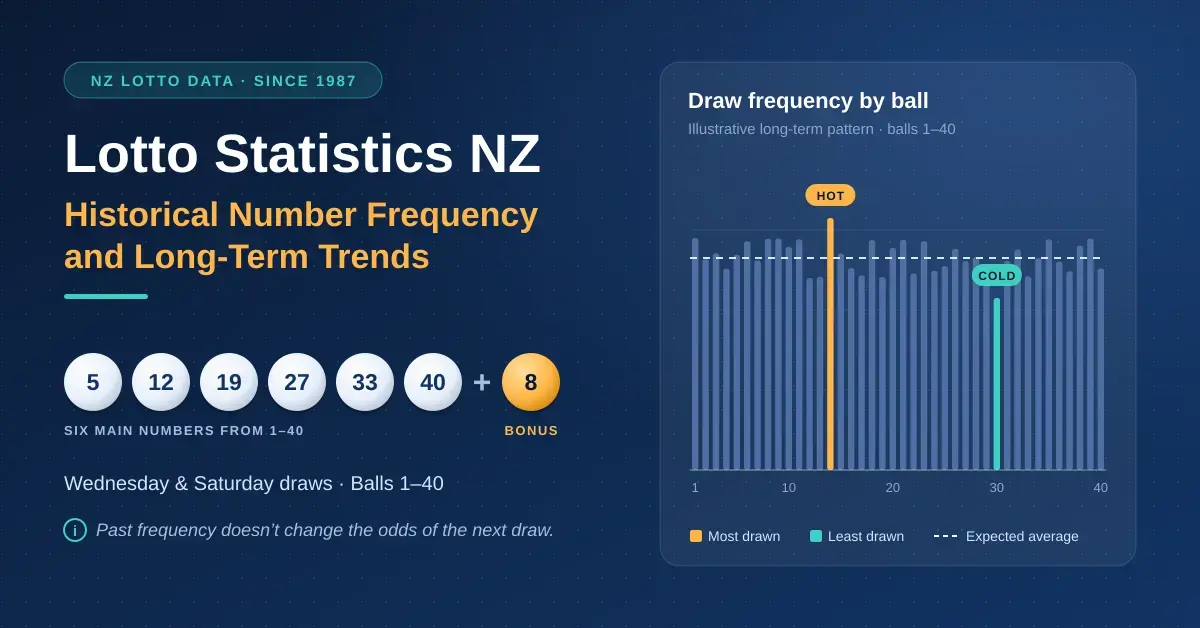
Historical Lotto statistics in New Zealand record how often each ball has been drawn since the game launched in 1987, and that archive is one of the most-searched resources among Kiwi players planning a Wednesday or Saturday ticket. The game is run by the New Zealand Lotteries Commission (trading as Lotto NZ) under audited, independently monitored conditions, so any long-term difference between a “hot” number and a “cold” one is simply the footprint of randomness over thousands of draws. Reading these frequency charts is a genuinely interesting way to understand the game’s history, but it is worth being clear from the start: past frequency does not change the odds of the next draw. This guide explains what the data shows, what it does not mean, and how the major September 2026 Powerball overhaul has reset part of the record.
Key Facts
- Lotto NZ draws six main numbers plus a Bonus Ball from a pool of 40 (1-40), every Wednesday and Saturday, and has done so since 1987.
- One line costs $0.70; a hand-picked coupon needs at least four lines ($2.80). Division 1 odds are about 1 in 3.8 million per line.
- Ball 1 is the most-drawn main number in Lotto history (around 449 appearances by mid-2024); 7, 13, 19, 22 and 23 also rank near the top.
- On 13 September 2026 Powerball expanded from 10 balls to 14, the starting jackpot rose to $5m, the cap to $60m, and a new Division 8 ($12) was added.
- Every ball has the same chance on every draw – past frequency does not change future odds.
- All New Zealand lottery prizes are paid out tax-free.
How New Zealand’s Lotto draw actually works
Lotto NZ draws six main numbers plus a seventh Bonus Ball from a single pool of 40 balls numbered 1 to 40, every Wednesday and Saturday. One line (your six chosen numbers) costs $0.70, and if you fill in a coupon by hand you must buy at least four lines, so the cheapest hand-picked ticket is $2.80. You can also take a computer-generated Dip instead of choosing numbers yourself. The odds of matching all six main numbers on a single line are about 1 in 3.8 million, and all New Zealand lottery prizes are paid out tax-free.
Because the balls are regularly inspected and the draws are independently supervised, the machine has no bias toward any number. Over thousands of draws, pure chance still produces an uneven spread: with six balls drawn from 40, each number is expected to appear in roughly 15% of draws, but normal random variation means some numbers sit a little above that line and others a little below. Those small, meaningless gaps are exactly what frequency charts display.
What historical frequency data shows
The single most-drawn main ball in New Zealand Lotto history is number 1. In draw-frequency figures reported in mid-2024, ball 1 had appeared around 449 times, more than any other number, while the least-drawn main ball at that point was number 14, at roughly 386 appearances. Those totals climb with every draw and the rankings behind ball 1 shift over time, so treat any snapshot as a point-in-time photo rather than a permanent league table.
The most-drawn main numbers
Beyond the clear leader, a small group of numbers consistently sits near the top of the long-run tables. The table below reflects the mid-2024 ranking as reported by New Zealand media using Lotto NZ data.
| Rank | Main ball | Notes |
|---|---|---|
| 1 | 1 | Most drawn in Lotto history (~449 appearances by mid-2024) |
| 2 | 19 | Long-term top-five regular |
| 3 | 23 | Consistently high frequency |
| 4 | 7 | A top-five fixture in almost every snapshot |
| 5 | 22 | Rose steadily in the 2010s to join the leaders |
For a continually updated breakdown of the full field, see the dedicated page on the most common Lotto numbers. Keep in mind that a number being drawn often in the past tells you nothing about tonight.
Why number 13 defies the superstition
Number 13 is a standout story in the New Zealand data. Despite its unlucky reputation in Western culture, it has long ranked among the most frequently drawn main numbers: in 2017 Lotto NZ noted it had come up about 318 times, making it the third most common number at that point. There is nothing mystical in that – it simply shows that the drum does not share human superstitions. Many players still leave 13 off their coupons, which, if anything, makes it slightly less likely to be a shared pick.
The least-drawn (cold) numbers
Cold numbers are the balls that have come up least often over the period you are measuring. In the mid-2024 figures, ball 14 sat at the bottom of the main pool. The important caveat is that the cold set is not fixed: a number near the bottom this year can rise through the middle of the field within a couple of seasons, because a short run of appearances is normal random behaviour, not a trend. A low historical count does not make a number “due”.
Powerball statistics and the September 2026 reset
Anyone studying historical Powerball frequency needs to know that the game changed substantially on 13 September 2026, which makes much of the older data a record of a retired format. Powerball is an optional add-on drawn from a separate machine; before the change, that machine held balls numbered 1 to 10.
From 13 September 2026, Lotto NZ expanded the Powerball pool from 10 balls to 14. At the same time the starting jackpot rose from $4 million to $5 million, the maximum jackpot cap rose from $50 million to $60 million, and a new Division 8 was introduced, paying a fixed $12 to any line matching two main numbers, the Bonus Ball and the Powerball. Division 7’s fixed prize increased from $15 to $20, and average prizes across Divisions 2 to 6 rose by roughly 45%. The trade-off is longer odds: the chance of winning Powerball Division 1 lengthened from about 1 in 38.4 million to about 1 in 53.7 million per line, although the price to play did not change. The first draw under the new format was held on 16 September 2026.
What the new 1-14 format means for number tracking
The four new balls – 11, 12, 13 and 14 – started with no draw history at all, so any historical Powerball frequency chart built before September 2026 covers only the old 10-ball pool and cannot describe the current game. In practice this means it will take many months of draws before a meaningful long-run picture of the 14-ball format exists. Until then, Powerball frequency data should be read as history rather than as a current guide. You can follow the reworked game and the full prize structure on the page covering the Powerball, and the detailed ball-by-ball history on the most drawn Powerball numbers page.
Reading combinations: pairs, triplets and clusters
Some trackers go beyond single balls and count how often pairs or triplets of numbers appear together in the same six-ball result. This is where statistics are most easily over-interpreted. Consecutive pairs such as 5 and 6, or 24 and 25, do appear in winning lines, and that surprises people who assume “random” means spread out – but a cluster of two or three neighbouring numbers is a completely normal feature of random draws.
The catch is sample size. Across the roughly 3,700-plus Lotto draws held since 1987, any specific pair or triplet will only have appeared a handful of times, so the difference between a combination that “led” the charts and one just behind it is usually a couple of occurrences – well within noise. Combination counts are a fun curiosity, not a reliable signal, and they should not be treated as a blueprint for building a ticket.
The hidden cost of playing popular numbers
Choosing the highest-frequency numbers carries a practical downside that has nothing to do with your odds of winning and everything to do with how much you would win: prize dilution. Lotto’s Division 1 prize and the Powerball jackpot are shared pools, split equally among every winning ticket nationwide on draw night.
Because thousands of players read the same published frequency charts, the popular “hot” numbers are heavily duplicated across the country. If a combination of well-known numbers does come up, it is more likely that several tickets share it, cutting each winner’s share. Birthdays make this worse by crowding selections into the 1-31 range. None of this changes your chance of winning – every line has identical odds – but it does affect the size of a win if it lands.
| Selection style | Typical duplication | Effect if the line wins |
|---|---|---|
| Popular “hot” numbers (e.g. 1, 7, 13, 19) | High | More likely to share the pool with other winners |
| Birthday-only numbers (1-31) | High | Clustered picks raise the chance of a split prize |
| Random Dip or a spread above 31 | Low | Same odds of winning, but a better chance of a sole prize |
If this matters to you, a plain computer Dip or a quick spread from a Lotto number generator avoids crowded picks without pretending to beat the draw.
The gambler’s fallacy and “overdue” numbers
The most common statistical mistake players make is the gambler’s fallacy: believing that a number which has not appeared for a while is “overdue” and more likely to come up next. It is not. The machine has no memory of previous draws. Every time the balls are loaded, the chance of any specific ball being selected resets to the same fixed value, completely independent of whether it appeared last week or last year. A ball’s long absence and a ball’s long hot streak are equally uninformative about the next result.
Common mistakes to avoid
- Treating hot numbers as more likely: frequency charts are history, not probability; every ball has the same chance on the next draw.
- Chasing “overdue” cold numbers: there is no catch-up mechanism forcing a number to appear.
- Reading too much into small samples: combination and pair counts are based on very few occurrences and are mostly noise.
- Ignoring prize dilution: copying popular statistical picks can shrink a win without improving the odds.
- Paying for “systems” that promise an edge: no selection method changes the fixed odds of a random draw.
- Spending beyond a set budget: rising jackpots make it easy to buy more lines than planned.
For a clear picture of what you are actually up against, the page on the odds of winning Lotto lays out the division-by-division probabilities.
Game variations: Strike, Keno and Bullseye
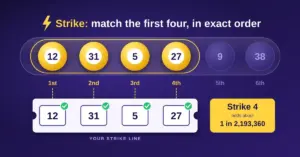
Frequency data behaves very differently across New Zealand’s other number games, so Lotto trends should never be carried over to them. Strike uses the same 40-ball Lotto draw but asks you to match the first four main balls in the exact order they are drawn, so position matters, not just frequency. Keno runs on a far larger 80-number field with 20 balls drawn per game, and Bullseye is a daily six-digit draw – both need their own dedicated charts.
Game Comparison
| Game | Number pool | What you match | Base price |
|---|---|---|---|
| Lotto | 6 main + Bonus Ball from 1-40 | Six main numbers | From $0.70 per line (min 4 lines) |
| Powerball | 1 extra ball from 1-14 (since 13 Sep 2026) | Your Lotto line plus the Powerball | Add-on to a Lotto line |
| Strike | First 4 main Lotto balls | Those 4 balls in exact drawn order | $1.00 per line |
| Keno | 20 drawn from 1-80 | Up to 10 chosen “spots” | Flexible, from $1 per game |
| Bullseye | A 6-digit number (000000-999999) | The drawn digits | Daily draw |
Each format carries its own odds and prize structure, so the idea of a single “lucky number” does not travel between them.
How Lotto NZ keeps draws random and fair
The randomness that underpins all of these statistics is protected by Lotto NZ’s draw procedures. Draws are conducted with certified ball sets and drawing machines, carried out under independent supervision, and the equipment is checked as part of routine integrity controls. Ball sets are tested and retired when they show wear, and multiple machines and sets are used so that no single piece of equipment is in play indefinitely. These measures are why the hot and cold patterns in the historical data can be attributed to chance alone rather than to any mechanical bias – and why no amount of past data can predict a future result.
Responsible Gambling and Disclaimer
This article is general information about historical lottery data, not betting advice. Lotto is a game of chance: studying frequency charts, hot and cold numbers, or combinations does not improve your odds of winning, and every ticket carries the same fixed probability regardless of how the numbers are chosen. New Zealand legislation passed in 2026 sets the minimum age for buying lottery products at 18. Only ever spend money you can afford to lose, set a limit before you play, and treat any purchase as entertainment rather than an investment. If gambling is causing harm to you or someone you know, free, confidential, 24/7 help is available from the Gambling Helpline Aotearoa on 0800 654 655 or by texting 8006.
Sources
- Lotto NZ (MyLotto) – Powerball changes
- Lotto NZ – More Powerballs, more prizes coming 13 September
- Stuff – Powerball odds to get longer as Lotto NZ adds four more balls
- 1News – Why tonight’s Lotto jackpot will be harder to win
- Stuff – Lotto: the luckiest Powerball number (draw-frequency reporting)
- New Zealand Legislation – Lotto game rules
- Gambling Helpline Aotearoa
Frequently Asked Questions (FAQ)
What is the most drawn Lotto number in New Zealand?
Number 1 is the most frequently drawn main ball in New Zealand Lotto history, having appeared around 449 times according to figures reported in mid-2024. Numbers such as 7, 13, 19, 22 and 23 also rank near the top, though the totals change with every draw.
Did New Zealand Powerball change in 2026?
Yes. On 13 September 2026 the Powerball pool expanded from 10 balls to 14, the starting jackpot rose to $5 million, the cap rose to $60 million, and a new Division 8 was added. The odds of winning Division 1 lengthened to about 1 in 53.7 million per line, while the ticket price stayed the same.
Do “hot” numbers have a better chance of being drawn?
No. Each draw is an independent event, so every ball has the same chance on any given night regardless of how often it has appeared before. A high historical count is a record of the past, not a prediction, and it does not make a number more likely to come up next.
What is the least drawn Lotto number?
It changes over time. In the mid-2024 figures the least-drawn main ball was number 14, but the cold set is not permanent – a number near the bottom one year can move into the middle of the field within a couple of seasons purely through normal random variation.
Does picking numbers from statistics improve my odds compared with a Dip?
No. A hand-picked line built from frequency charts has exactly the same odds as a random computer Dip. Statistics can make choosing more interesting, but they cannot beat the draw, and copying popular picks can actually mean sharing any prize with more winners.