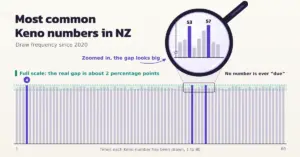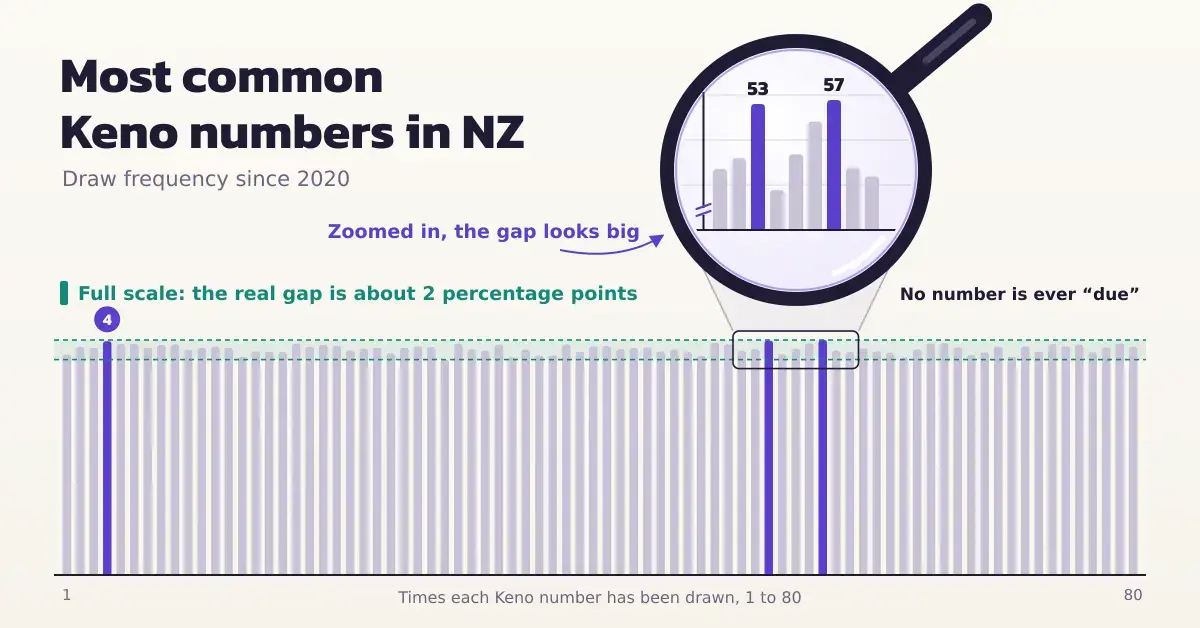
Across New Zealand’s four daily Keno draws, a handful of numbers — among them 57, 53 and 4 — have come up slightly more often than the rest since the start of 2020. That can look like a pattern worth chasing. In reality the gap between the most-drawn and least-drawn numbers is tiny, and it says nothing about what will appear in the next draw. This guide sets out the actual frequency figures, explains how Keno works in New Zealand, and shows why a “common” number is a record of the past rather than a tip for the future.
Key Points
- The leaders are close: 57, 53 and 4 have been drawn most often in NZ Keno since 2020, but only by a hair.
- The gap is tiny: the most and least drawn numbers differ by about 218 draws out of roughly 10,000 — around two percentage points.
- No number is ever “due”: every draw is independent, and each number has about a 25% chance of appearing each game.
- Number choice does not change your payout: NZ Keno pays fixed prizes by spots matched and stake, unlike Lotto’s shared divisions.
- Use the data for fun, not forecasting: frequency charts record the past; they cannot predict the next draw.
How New Zealand Keno works (and why it shapes the stats)
Keno in New Zealand is run by Lotto NZ. In every game a certified random number generator draws 20 numbers from a field of 1 to 80, and there are four draws a day. Because 20 of the 80 numbers come up each time, any single number has a one-in-four chance — about 25% — of being drawn in any given game. That is a very high hit rate compared with a Lotto ball, so Keno numbers pile up appearances quickly, and over thousands of draws they settle close to that 25% expectation.
You choose between one and ten numbers, called “spots”, and your prize depends on how many of your spots match and how much you staked. You can read more about how New Zealand Keno results work and where to check them. Here is the game at a glance:
| Feature | Detail |
|---|---|
| Operator | Lotto NZ |
| Numbers drawn | 20 from a field of 1–80 |
| Spots you pick | Between 1 and 10 |
| Draws per day | 4 — 10am, 1pm, 3pm and 6pm (NZ time) |
| Line price | From $1, with stakes up to $100 per selection |
| Optional add-on | Multiplier of 1.5x, 2x, 3x, 5x or 10x on non-jackpot prizes |
| Biggest single standard prize | $250,000 |
| Chance any one number is drawn | About 25% per draw |
What “most common Keno numbers” actually means
A “most common” or “hot” Keno number is simply one that has been drawn more times than others over a chosen stretch of history. It is a backward-looking tally, not a quality built into the number itself. Change the time window and the leaderboard changes with it, which is why different statistics sites publish different lists for the same game.
None of these counts carries any information about the next draw. A frequency table answers the question “which numbers have appeared most so far?” — it does not, and cannot, answer “which numbers will appear next?”. Keeping those two questions separate is the single most important idea on this page.
The most and least drawn Keno numbers in New Zealand
The figures below come from an independent draw tracker and cover roughly 10,000 Keno draws between 1 January 2020 and 2 November 2026. Over that period every number was expected to appear about 2,500 times (25% of the draws). The table shows how close the real counts stay to that expectation.
Keno Number Frequency
| Number | Times drawn (Jan 2020 – Nov 2026) | Status |
|---|---|---|
| 57 | 2,606 | Most drawn |
| 53 | 2,604 | Most drawn |
| 4 | 2,588 | Most drawn |
| 41 | 2,573 | Most drawn |
| 43 | 2,566 | Most drawn |
| 32 | 2,563 | Most drawn |
| 62 | 2,550 | Most drawn |
| 68 | 2,549 | Most drawn |
| 3 | 2,433 | Least drawn |
| 47 | 2,430 | Least drawn |
| 77 | 2,426 | Least drawn |
| 44 | 2,422 | Least drawn |
| 11 | 2,401 | Least drawn |
| 37 | 2,399 | Least drawn |
| 59 | 2,398 | Least drawn |
| 69 | 2,388 | Least drawn |
Expected appearances for any number over the period: about 2,500 (25% of roughly 10,000 draws). Figures are from an independent draw tracker and are not official Lotto NZ statistics.
The most frequently drawn numbers
Number 57 sits narrowly on top with 2,606 appearances, followed by 53 on 2,604 and 4 on 2,588. After them come 41, 43, 32, 62 and 68, all within a few draws of each other. The leaders are bunched so tightly that their order would reshuffle after a few more weeks of draws — a sign you are looking at random variation, not a ranking that means anything.
The least frequently drawn numbers
At the other end, number 69 has been drawn the fewest times at 2,388, with 59, 37 and 11 just above it. These “cold” numbers are not broken or overdue; they have simply landed on the low side of normal statistical scatter. On current evidence they are exactly as likely to be drawn in the next game as any hot number.
How big is the gap, really?
The gap between the most-drawn (2,606) and least-drawn (2,388) number is about 218 draws. Spread across roughly 10,000 draws, that is a difference of only around two percentage points — the hottest number has appeared about 26% of the time and the coldest about 24%, against an expectation of 25%. In a truly random game of this size, a spread that small is exactly what probability predicts. It is noise, not a signal you can bet on.
Why frequency data cannot predict the next draw
Every draw is independent
Each Keno game starts from a clean slate. The random number generator selects 20 fresh numbers from 1 to 80 with no memory of what came before, so the result of this draw has no effect on the next one. A number that appeared in all four of today’s draws is no more or less likely to appear tomorrow than one that has been absent for a month.
There are no “due” numbers
Believing a cold number is “due” to catch up is the gambler’s fallacy — the mistaken idea that independent random events balance themselves out in the short run. Numbers do drift toward their expected frequency over time, but they do so because future draws are random, not because the game corrects past imbalances. There is no mechanism that makes an under-drawn number more likely next time.
Hot and cold numbers explained
“Hot” and “cold” are just labels trackers attach to the top and bottom of a frequency list for a selected window. They describe history in plain terms, which is useful for reading a chart, but they carry no predictive weight. A hot number is not lucky and a cold number is not primed — both face the same 25% chance in the next draw. If you enjoy following the trends, the guide to Keno tools and trackers explains what these generators and hot-and-cold displays actually do.
Does choosing common numbers change what you win?
No. New Zealand Keno pays fixed prizes based on how many of your spots match and how much you staked, so the specific numbers you pick do not change your payout or your odds. Two players who match the same number of spots at the same stake win the same amount, whatever numbers they chose.
This is where Keno differs sharply from Lotto. In a Lotto draw the top prizes are shared among everyone holding a winning line, so picking unpopular numbers can reduce the chance of splitting a jackpot — an idea explored in the articles on the most common Lotto numbers and the most common Powerball numbers. Keno has no shared divisions of that kind, so a “common number” strategy has nothing to work on. For a wider view of the maths behind every game, see the breakdown of the odds of winning across Lotto NZ games.
Common mistakes players make with Keno number data
- Treating hot numbers as more likely. Past frequency is not probability; every number keeps its 25% chance per draw.
- Chasing cold numbers as “due”. Nothing forces an under-drawn number to catch up.
- Reading tiny samples as trends. A list of the last 20 draws is almost all noise; short windows swing wildly and mean little.
- Mixing up the four draw times. The 10am, 1pm, 3pm and 6pm draws are separate games; lumping or splitting their data does not reveal a pattern either way.
- Buying more to “cover” patterns. Adding spots, lines or the Multiplier raises what you spend, not your chance of matching.
- Assuming more spots means better odds. Picking 10 spots does not make you more likely to win; it changes the prize structure and the odds of a full match get very long.
How to use Keno statistics sensibly
Frequency data is best treated as entertainment and record-keeping, not as a forecasting tool. Because the numbers you choose cannot change your odds, there is no statistical reason to prefer hot numbers, cold numbers, birthdays or a quick Dip — pick whatever you enjoy. If you want to play, the sensible steps are the same ones that apply to any game of chance: decide a budget before you start, understand that longer odds come with larger spot games, and never stake money you cannot afford to lose. For a realistic look at what does and does not help, the guide to Keno strategy in New Zealand goes further, and the overview of how to play Lotto, Powerball, Strike and Keno covers the basics.
A note on responsible play
Keno is a form of gambling. Every draw is random, and no number, system, hot-and-cold chart or frequency list can improve your chance of winning or change a fixed prize. Over time the game is designed to return less than it takes in, so only ever play with money you can afford to lose and treat any winnings as a bonus, not an expectation. If gambling is causing harm for you or someone you know, free and confidential help is available 24/7 from the Gambling Helpline Aotearoa on 0800 654 655 (or text 8006). This article is factual information only and is not betting advice.
Sources
Frequently Asked Questions (FAQ)
What are the most common Keno numbers in NZ?
Over roughly 10,000 draws between January 2020 and November 2026, the numbers drawn most often were 57, 53 and 4, followed closely by 41, 43 and 32. The difference between these and the least-drawn numbers is only about two percentage points, so the “most common” label reflects small, random variation rather than any real pattern.
Are hot Keno numbers more likely to be drawn next?
No. Each Keno draw is independent and random, so a number that has come up often carries no extra chance of appearing again. Every number has about a 25% chance of being among the 20 drawn in any single game, regardless of its past history.
How many numbers are drawn in a New Zealand Keno game?
Twenty numbers are drawn at random from a field of 1 to 80 in each game, and there are four draws a day at 10am, 1pm, 3pm and 6pm New Zealand time. You choose between one and ten of your own numbers, known as spots.
Does picking rare or “overdue” numbers win more money?
No. New Zealand Keno pays fixed prizes based on how many of your spots you match and your stake, not on which numbers you chose. Two players matching the same number of spots at the same stake win the same amount, so there is no payout advantage in picking rare numbers.
Can any strategy improve your Keno odds?
No strategy changes the odds of the numbers themselves, because the draw is random. The only thing in your control is how many spots you play and how much you stake, which changes the prize structure and the odds profile but never makes a win more likely for a given game.